Backend application monitoring
Backend applications are being deployed using AWS ECS Fargate.
This also applies to dynamic frontend applications (aka server-side rendering).
Viewing
You can view monitoring metrics in the AWS console. There are several places where you can find them. The most important are:
ECS Service
There are several important monitoring metrics in the AWS ECS console. To view them you first have to find your application's ECS service:
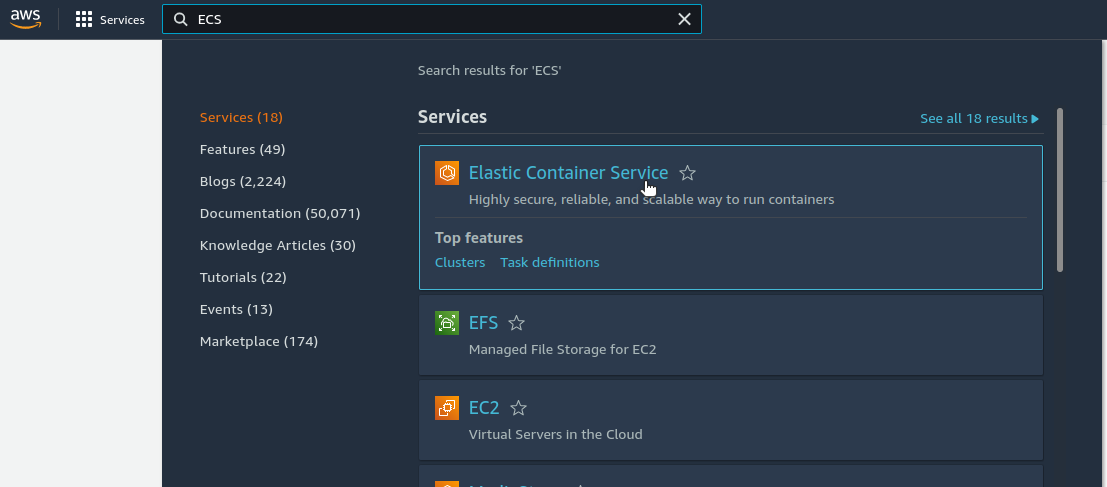
- Find and select the ECS console:
- Select an appropriate ECS cluster:
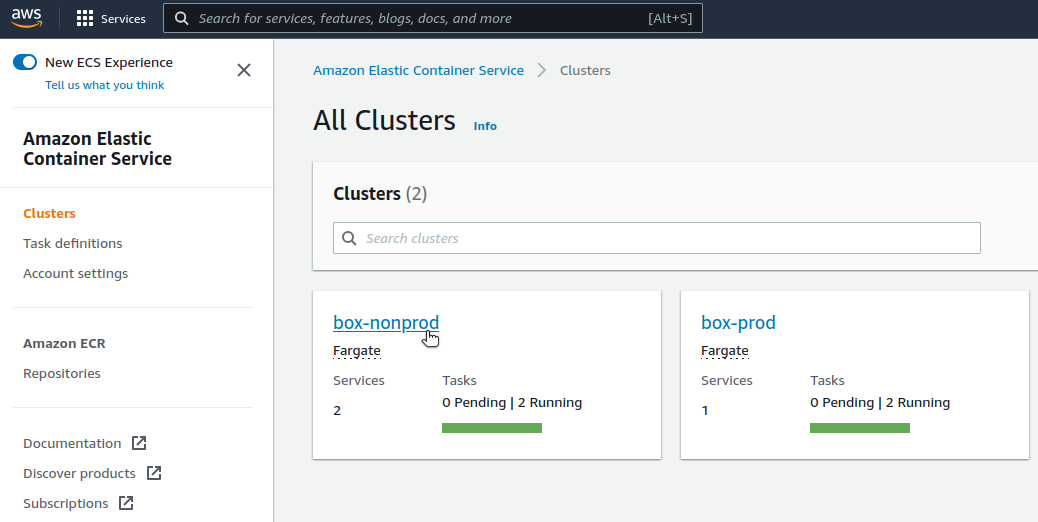
- Find and select your ECS service. The name starts with your application's name (
e.g.
devopsbox-io-example-backend-app) and environment name (e.g.staging), all the.and/characters are replaced with-:

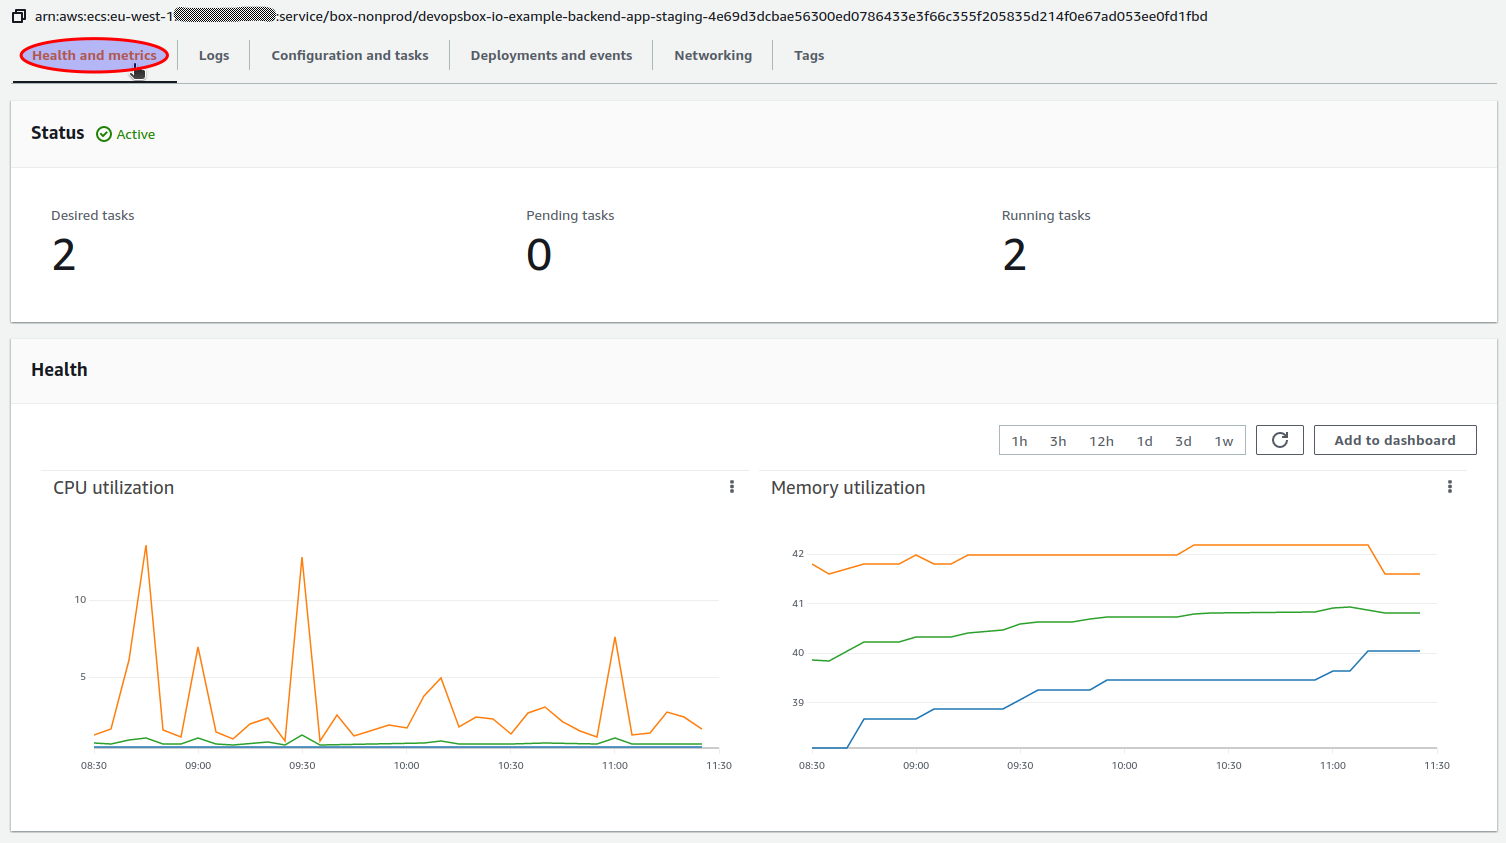
Health and metrics
In the AWS ECS console you can view basic metrics for your ECS service like CPU or RAM. To access them open
the Health and metrics tab:
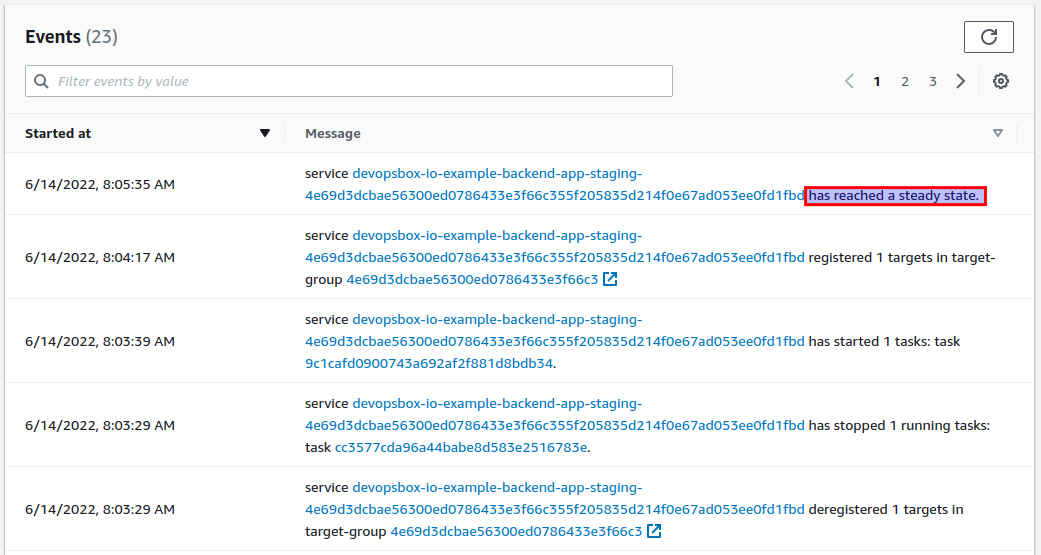
Deployments and events
On the Deployments and events tab you can find ECS events, they give you one of the most important information about
your application's health:
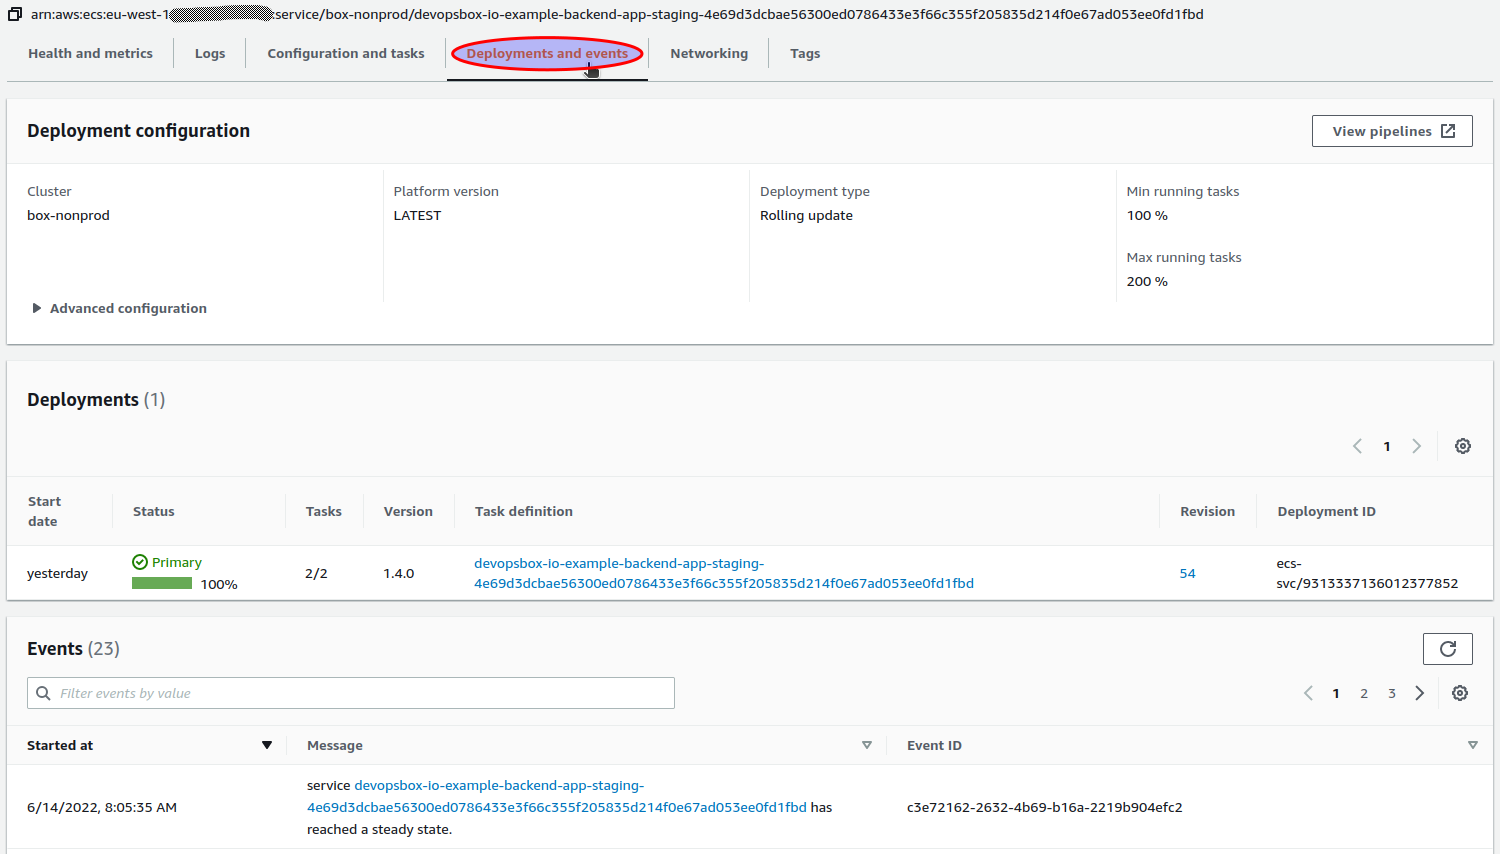
If the latest event does not end with "...has reached a steady state.", it means that there can be something wrong with
your application, or it is currently being deployed. It should look like this:
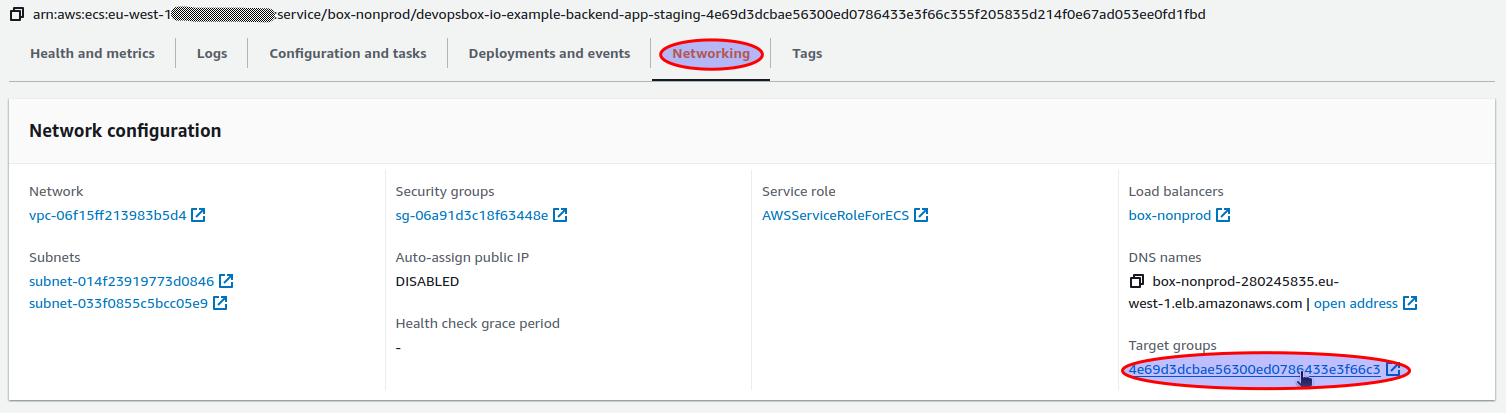
Load Balancer
Some metrics can be viewed in the AWS EC2 Load Balancers console. You can access them by clicking on the target group in
the Networking tab:
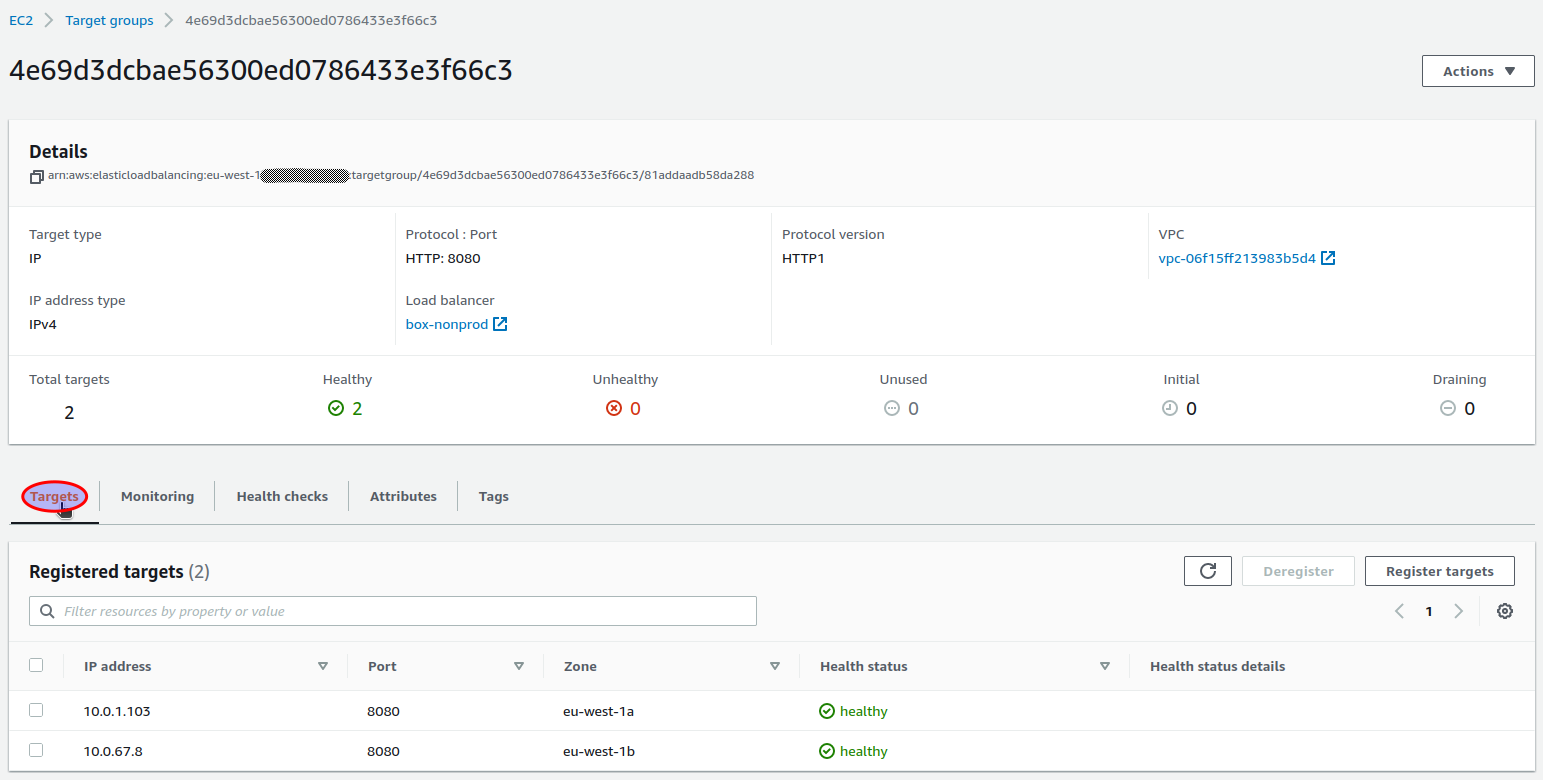
Targets
In the Targets tab you can check information about ECS tasks status e.g. if they are healthy:
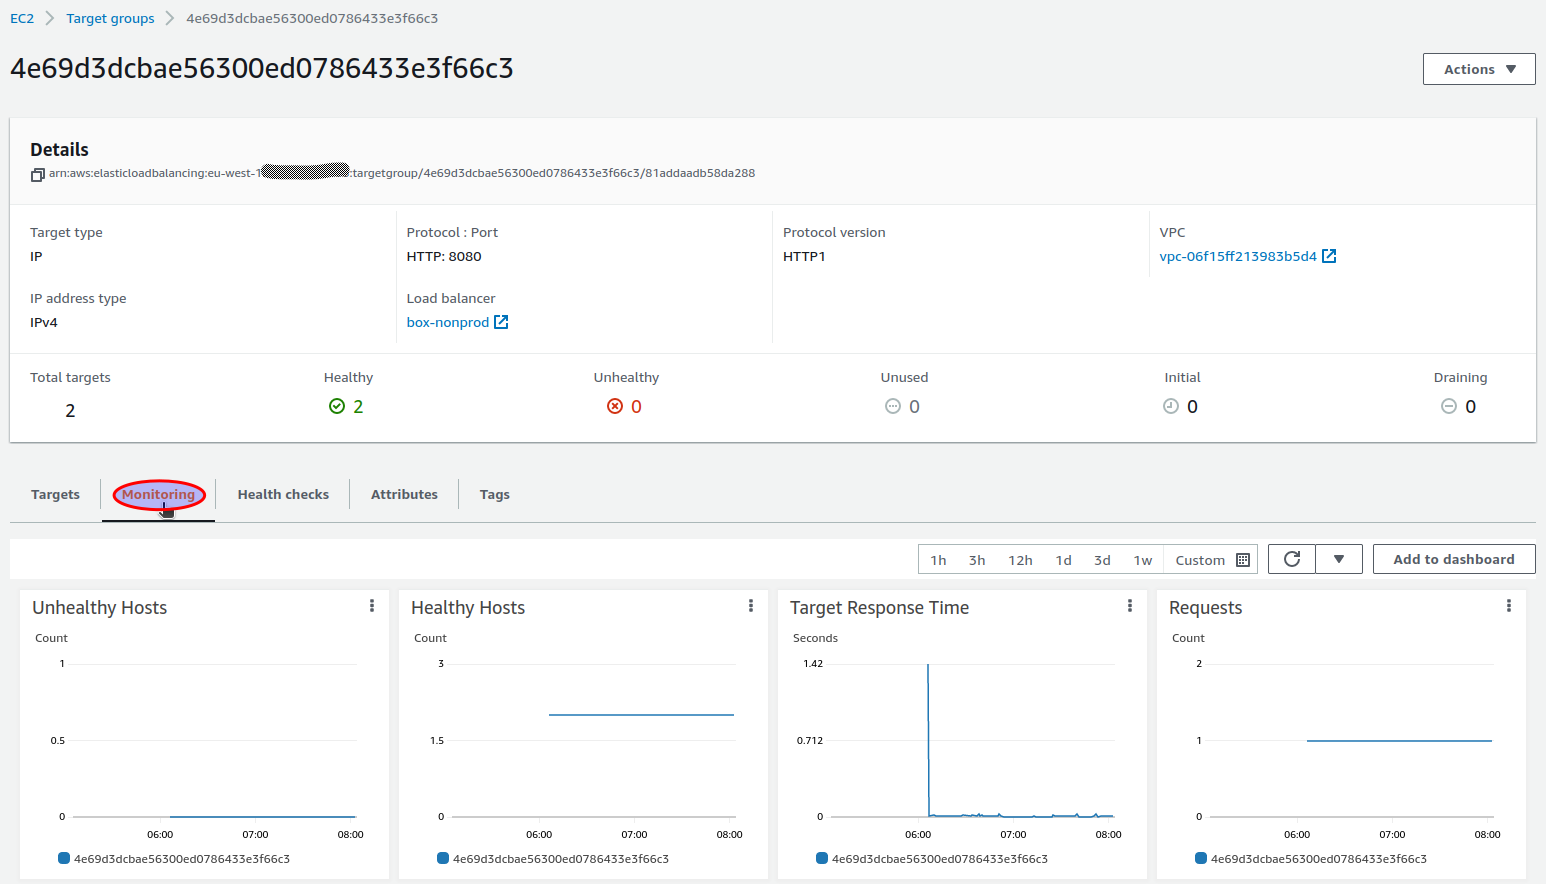
Monitoring
You can view various health check and http related metrics on the Monitoring tab:
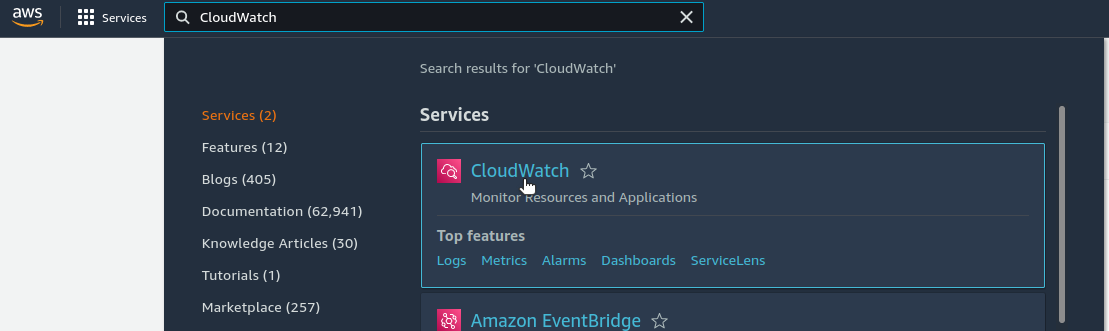
CloudWatch
Monitoring metrics can be accessed in the AWS CloudWatch console. To show them you have to open the All metrics view:
- Find and select the CloudWatch console:
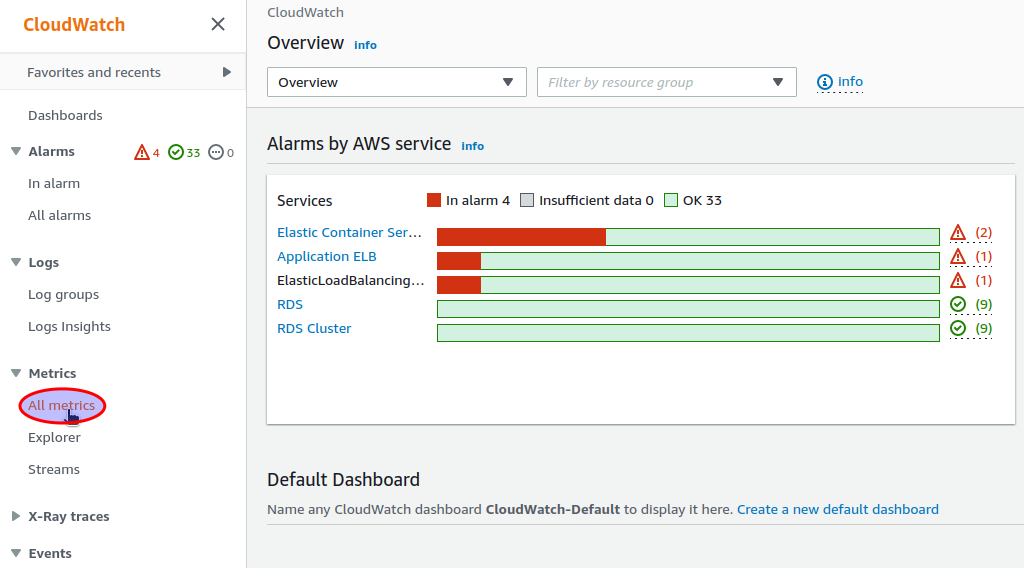
- Select the
All metricsview:
ECS Service
To access ECS Service metrics in the CloudWatch console, first you have to obtain the ECS Service name (check "Find and
select your ECS service" in ECS Service), it should look like APP_NAME-ENVIRONMENT-LONG_HASH (
e.g. devopsbox-io-example-backend-app-dev-51b094df6cdf92185cbbb3a6832425bb6a2abd711545ec569a3cde9c245d9098).
Then you can show all metrics related to your service by entering ServiceName="YOUR_SERVICE_NAME" (
e.g. ServiceName="devopsbox-io-example-backend-app-dev-51b094df6cdf92185cbbb3a6832425bb6a2abd711545ec569a3cde9c245d9098"):
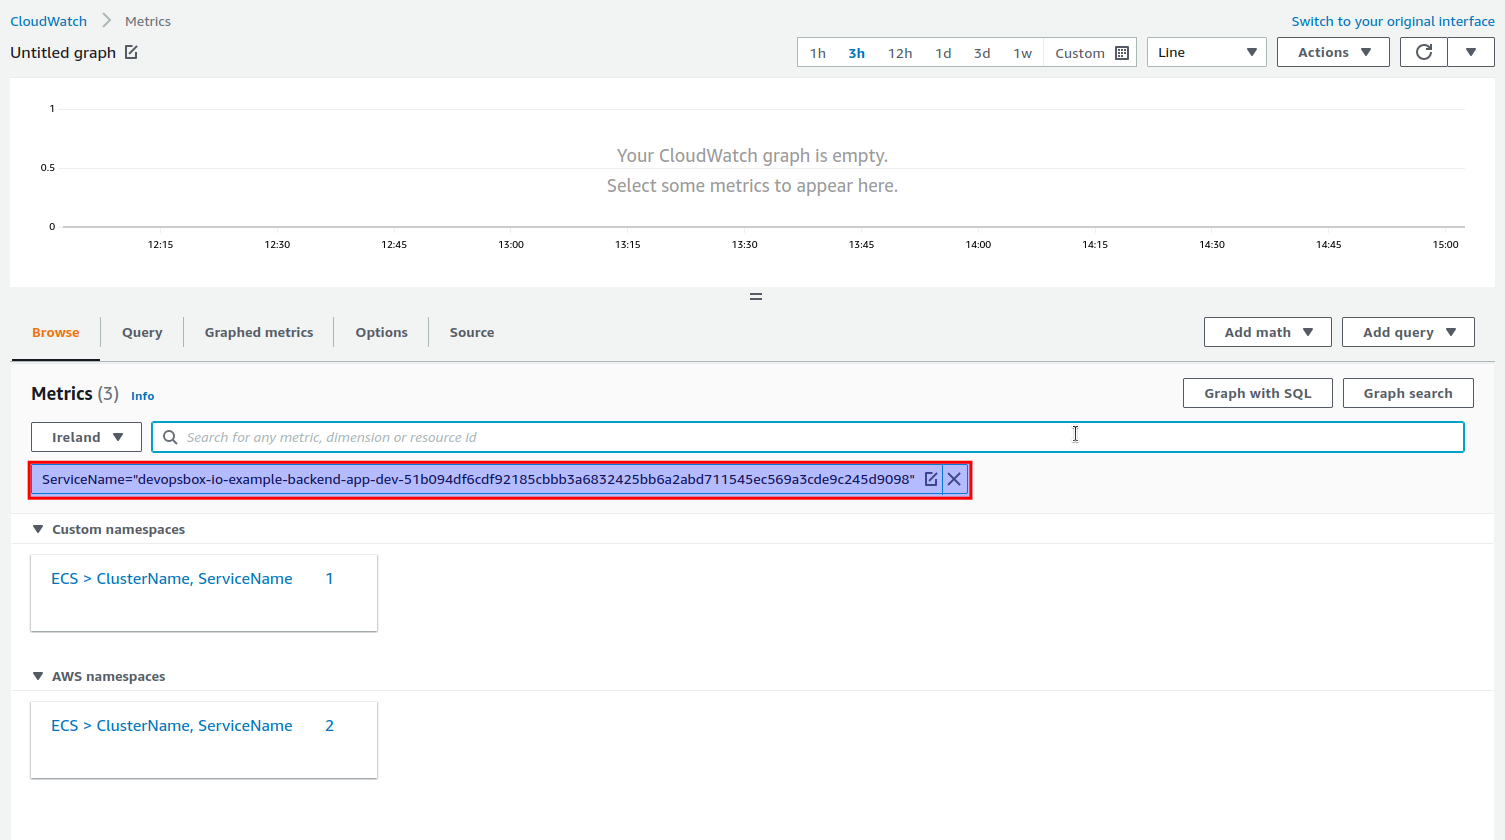
Here you can access all the standard ECS Service metrics and an additional custom metrics called SteadyState.
Steady State custom metric
The SteadyState custom metric indicates if the last event of your service ends with "...has reached a steady state." (
value=1) or not (value=0).
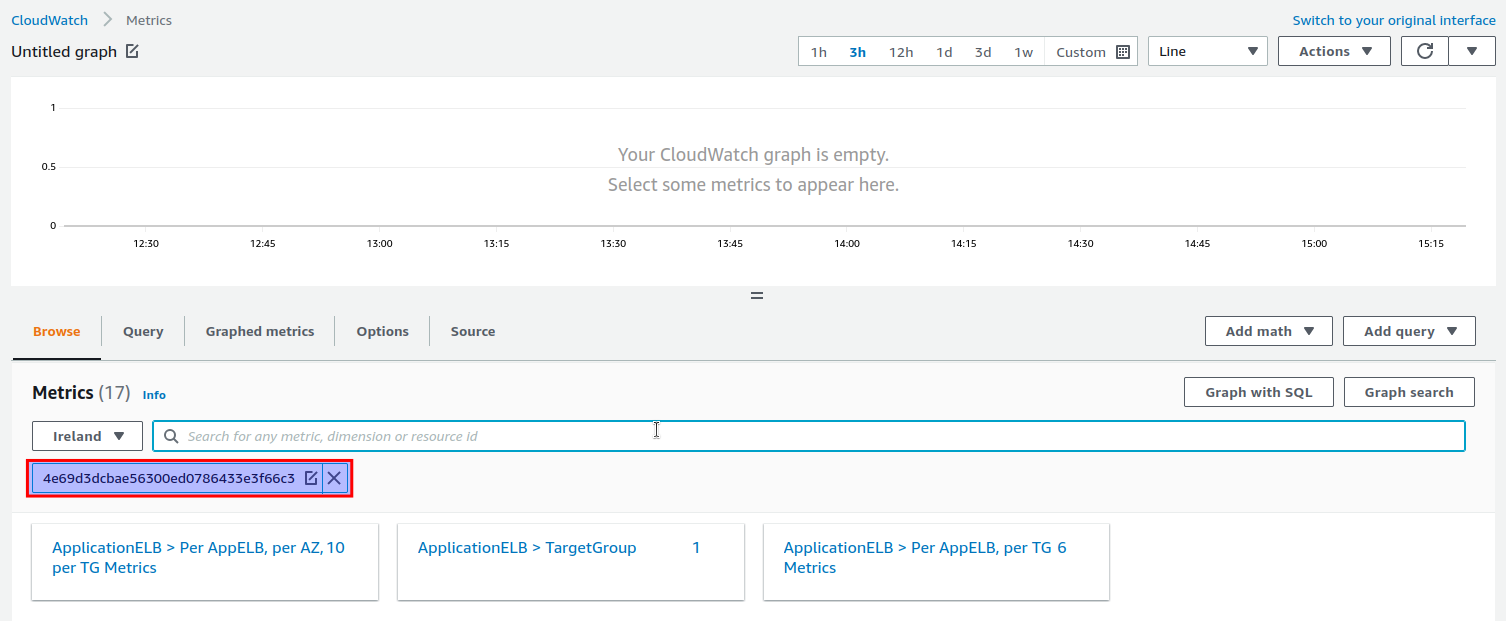
Load Balancer
To access the Application Load Balancer metrics related to your application, first you have to obtain the Target Group name (check the "Networking" tab in the ECS Service view).
Then you can show all metrics related to your app by entering YOUR_TARGET_GROUP_NAME (
e.g. 4e69d3dcbae56300ed0786433e3f66c3"):
External health
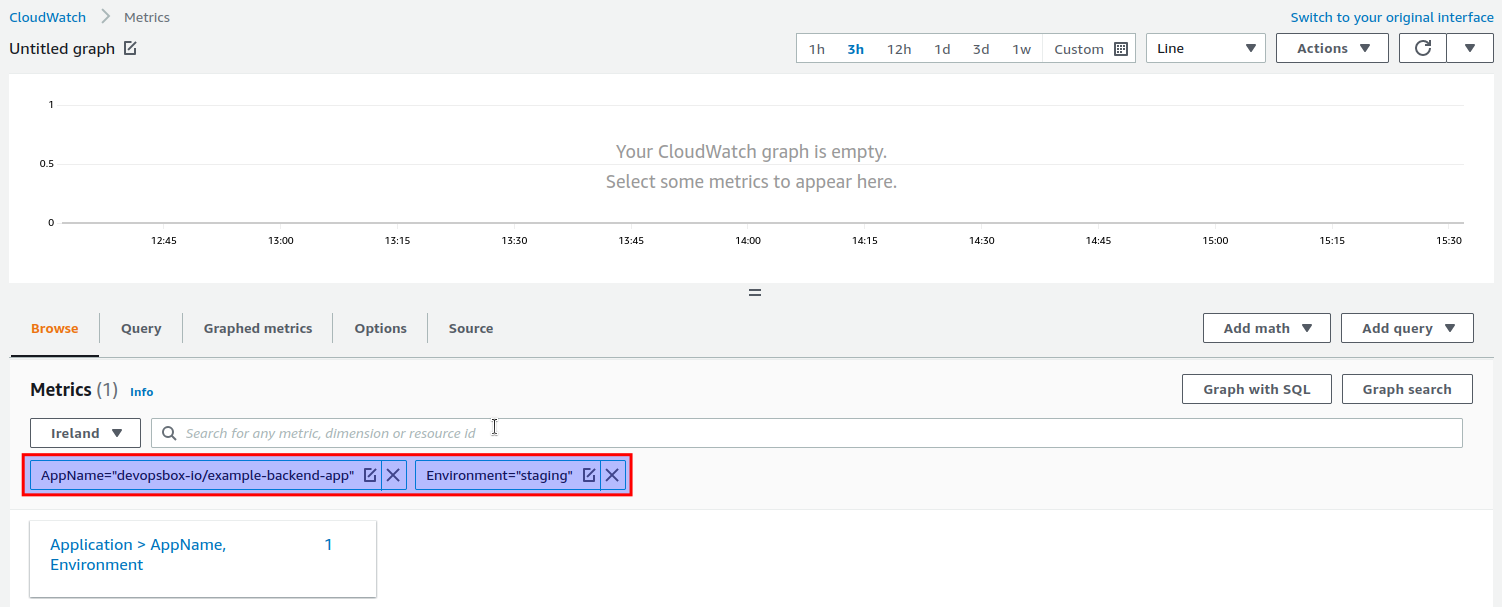
The ExternalHealthStatus custom metric indicates the "external" health status of your application. The value equals
the HTTP status obtained by calling your application's health check with AWS Lambda deployed outside your VPC. You can
find the metric by entering AppName="APP_NAME" and Environment="ENVIRONMENT" (
e.g. AppName="devopsbox-io/example-backend-app" and Environment="staging"):
Notifications
There are multiple CloudWatch alarms created for your application, all of them are sending notifications to an SNS
topic. There is a single SNS topic created for each cluster, for example box-nonprod-monitoring-notification
and box-prod-monitoring-notification.
You can subscribe to an SNS topic - there are multiple options, one of them is Slack via AWS Chatbot.
Alarms
Following alarms are created for each of your backend applications:
APP_NAME.ENVIRONMENT.UnHealthyTasks(e.g.devopsbox-io/example-backend-app.staging.UnHealthyTasks) - sends a notification when there is at least 1 ECS Task considered unhealthy.APP_NAME.ENVIRONMENT.TargetResponseTime(e.g.devopsbox-io/example-backend-app.staging.TargetResponseTime) - sends a notification when the average response time over the last 5 minutes is more than 3 seconds.APP_NAME.ENVIRONMENT.SteadyState(e.g.devopsbox-io/example-backend-app.staging.SteadyState) - sends a notification when your ECS Service is not in the steady state (based on the Steady State custom metric).APP_NAME.ENVIRONMENT.MinimumTasks(e.g.devopsbox-io/example-backend-app.staging.MinimumTasks) - sends a notification when the number of ECS Tasks is lower than the minimum (usually 2).APP_NAME.ENVIRONMENT.MaximumTasks(e.g.devopsbox-io/example-backend-app.staging.MaximumTasks) - sends a notification when the number of ECS Tasks has reached the maximum (default is 5).APP_NAME.ENVIRONMENT.HttpStatus500(e.g.devopsbox-io/example-backend-app.staging.HttpStatus500) - sends a notification when there is at least 1 5xx error over the last minute.APP_NAME.ENVIRONMENT.HttpStatus400(e.g.devopsbox-io/example-backend-app.staging.HttpStatus400) - sends a notification when there is at least 5 4xx errors over the last 5 minutes.APP_NAME.ENVIRONMENT.ExternalHealth(e.g.devopsbox-io/example-backend-app.staging.ExternalHealth) - sends a notification when the external health check fails (based on the External health metric).