PostgreSQL
One of the supported backing services is PostgreSQL. It can be created by adding the following lines to your box.yaml:
backing_services:
  postgresql: { }
Viewing
You can view monitoring metrics in the AWS console. There are several places where you can find them. The most important are:
RDS monitoring view
You can view some monitoring metrics in the AWS RDS console. To show them you have to open the Monitoring view:
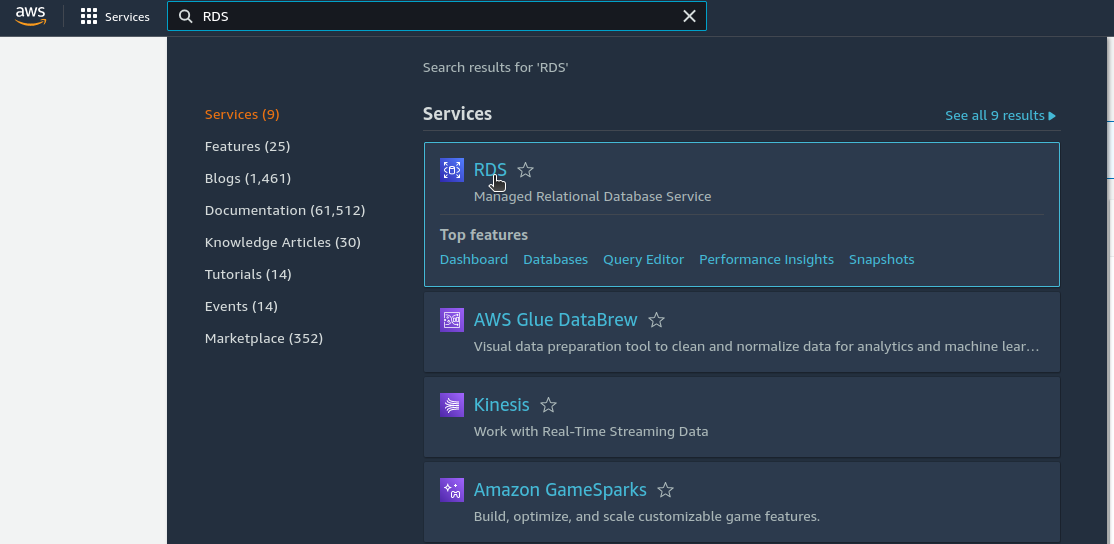
- Find and select the RDS console:
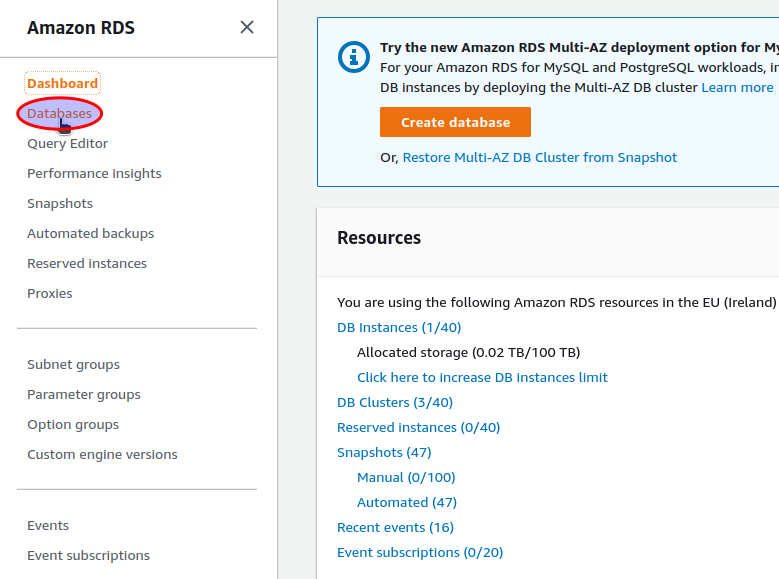
- Open the
Databasesmenu item:
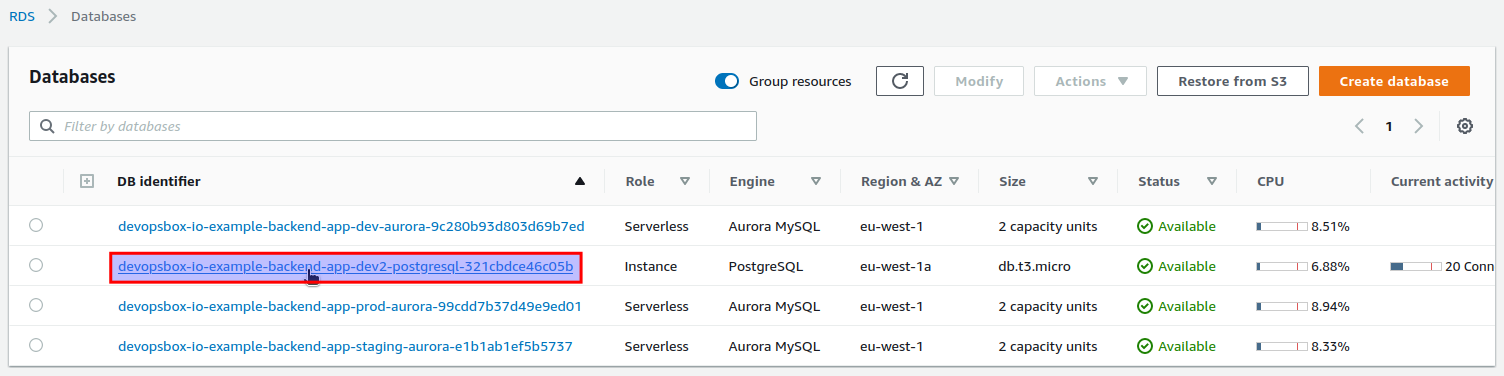
- Select your PostgreSQL RDS instance. The naming convention is
APP_NAME-ENVIRONMENT-BACKING_SERVICE_KEY-HASH, all the.and/characters are replaced with-(e.g.devopsbox-io-example-backend-app-dev2-postgresql-321cbdce46c05b):
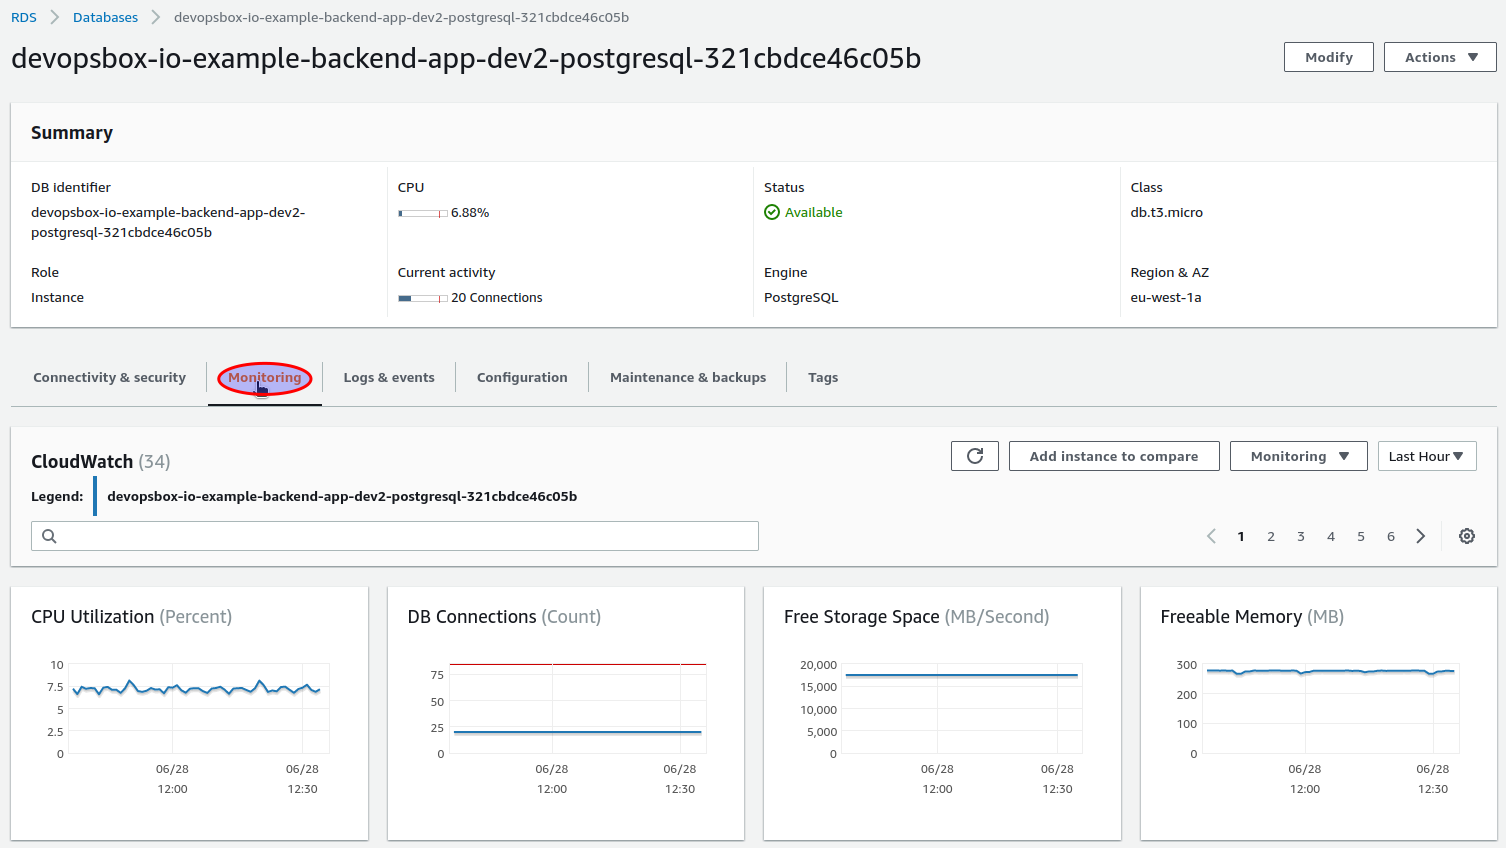
- Metrics are available in the
Monitoringtab:
CloudWatch
To access PostgreSQL metrics in the CloudWatch console, first you have to obtain the RDS instance identifier (check "
Select your PostgreSQL RDS instance" in RDS monitoring view). An example of an instance
identifier is devopsbox-io-example-backend-app-dev2-postgresql-321cbdce46c05b.
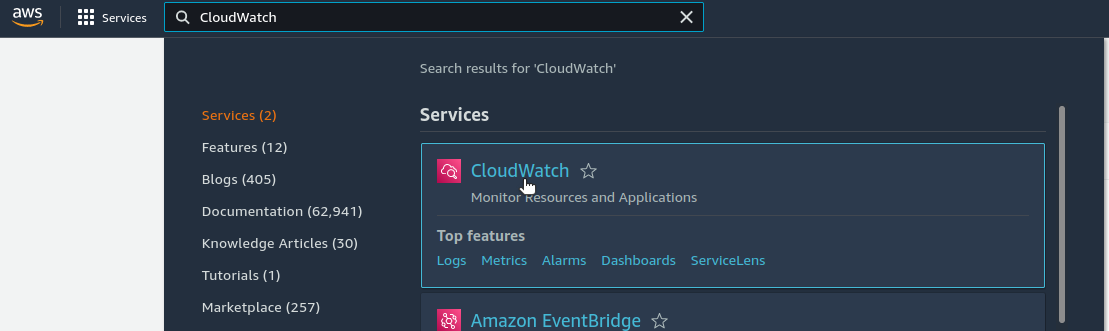
Monitoring metrics can be accessed in the AWS CloudWatch console. To show them you have to open the All metrics view:
- Find and select the CloudWatch console:
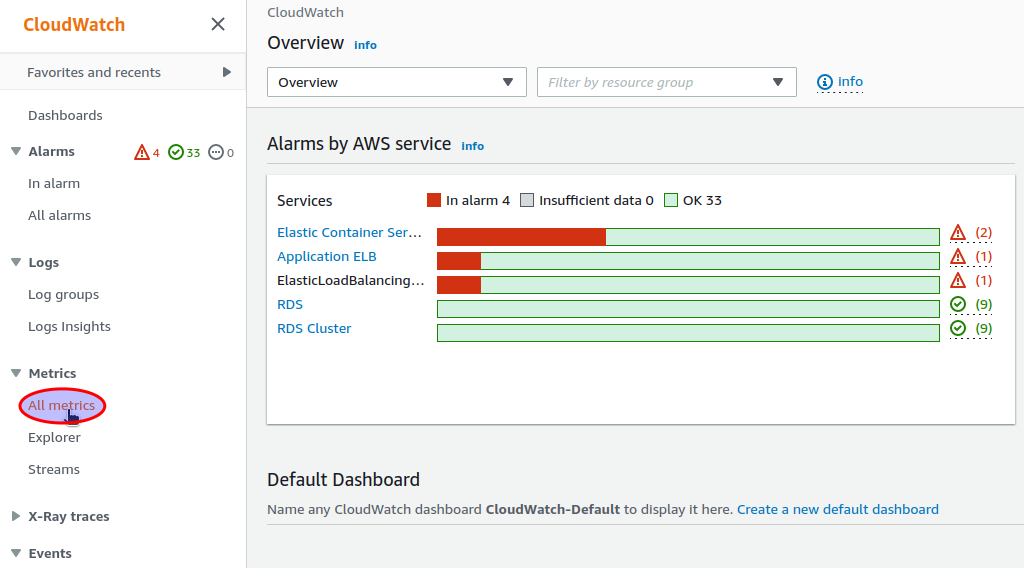
- Select the
All metricsview:
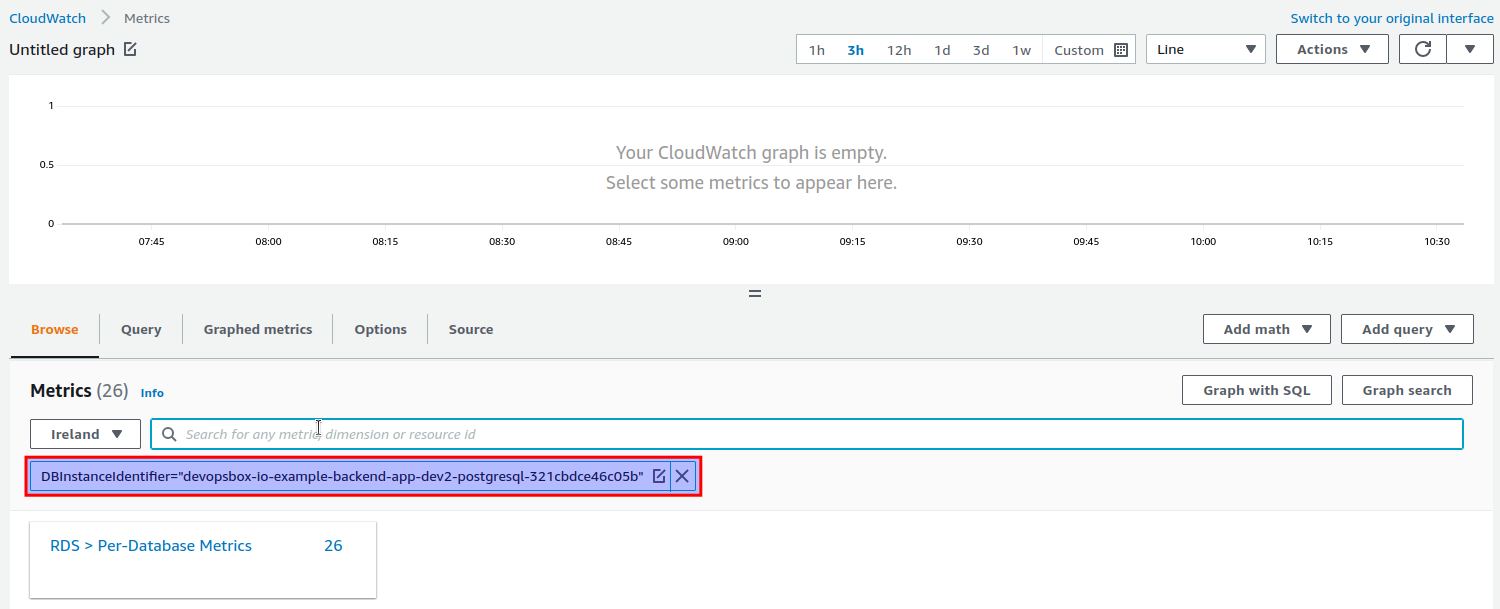
Then you can show all metrics related to your RDS instance by
entering DBInstanceIdentifier="YOUR_RDS_INSTANCE_IDENTIFIER" (
e.g. DBInstanceIdentifier="devopsbox-io-example-backend-app-dev2-postgresql-321cbdce46c05b"):
Notifications
There are no CloudWatch alarms or notifications automatically created for the PostgreSQL backing service.