Static frontend application monitoring
Static frontend applications are being deployed using S3 + CloudFront by setting STATIC_WEBSITE deployment type in
your box.yaml:
deploy:
  type: STATIC_WEBSITE
Viewing
You can view monitoring metrics in the AWS console. There are several places where you can find them. The most important are:
CloudFront monitoring view
You can view some monitoring metrics in the AWS CloudFront console. To show them you have to open the Monitoring view:
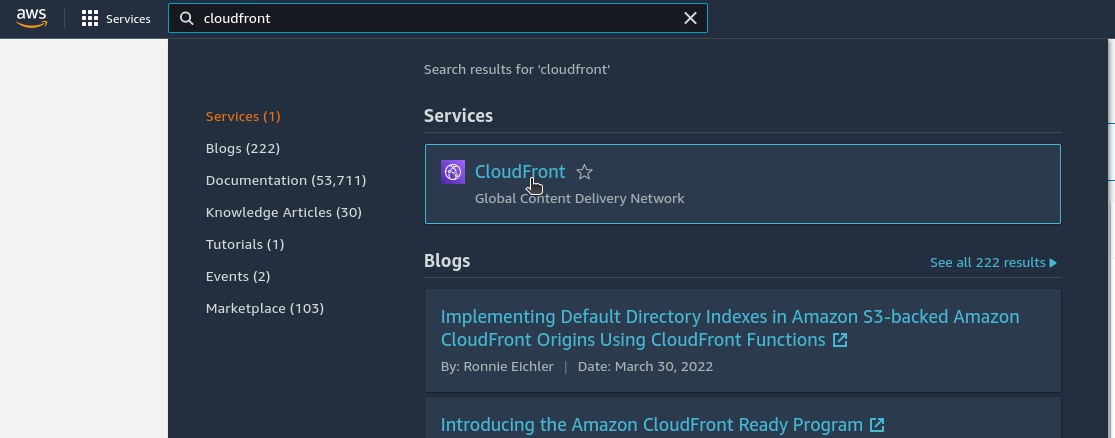
- Find and select the CloudFront console:
- Select the
Monitoringview:
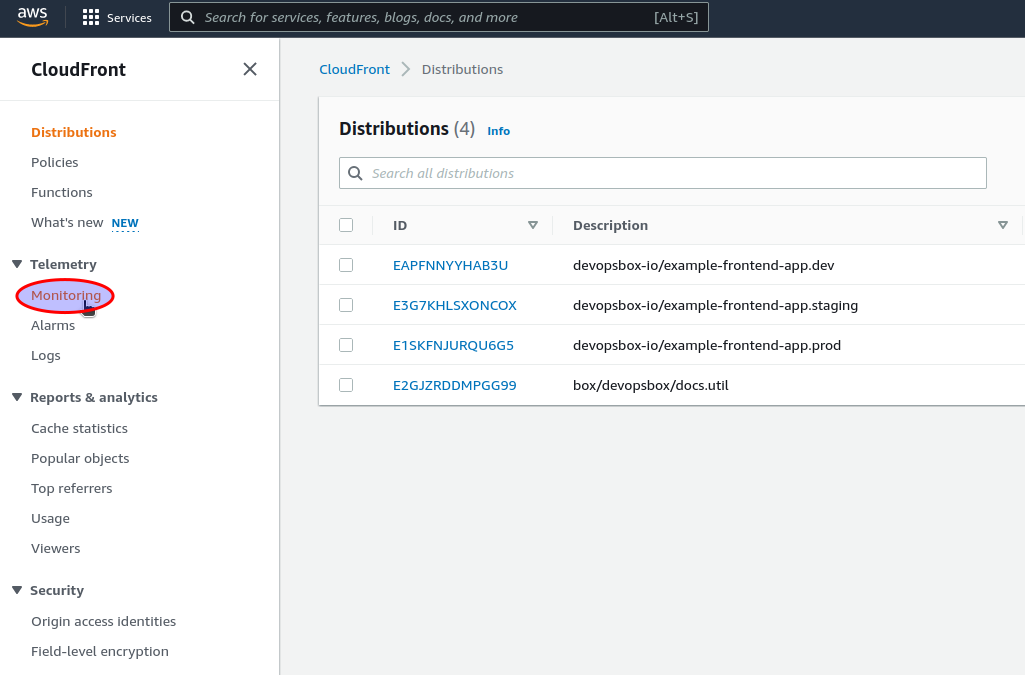
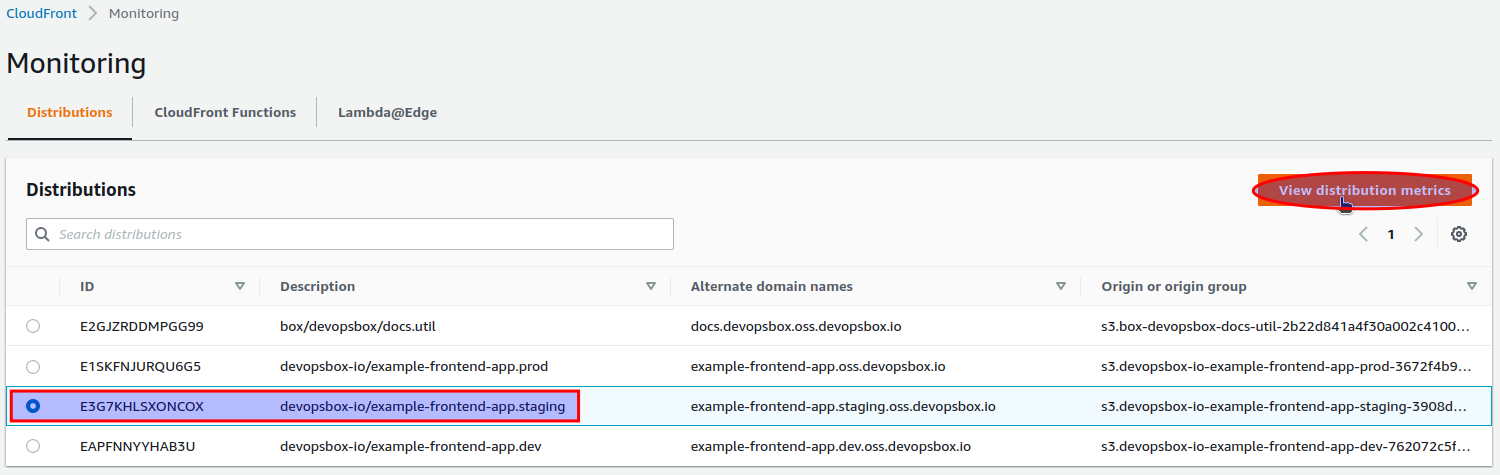
- Find and select CloudFront distribution and click
View distribution metricsbutton. TheDescriptionfield contains your application's name (e.g.devopsbox-io/example-frontend-app) concatenated with.and the environment name ( e.g.staging):
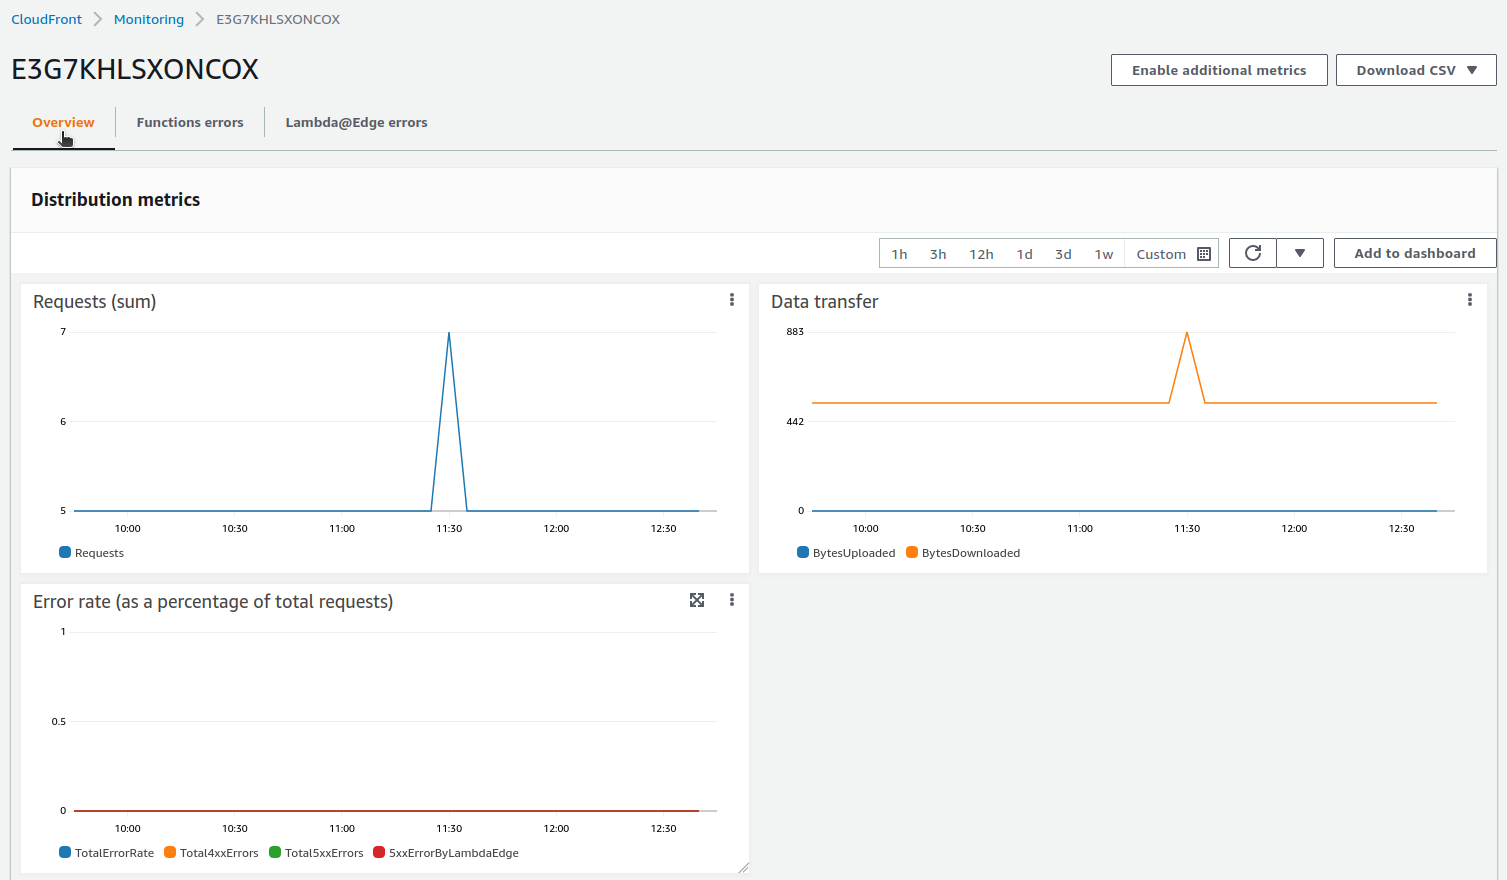
- Metrics are available in the
Overviewtab:
CloudWatch
Monitoring metrics can be accessed in the AWS CloudWatch console. To show them you have to open the All metrics view:
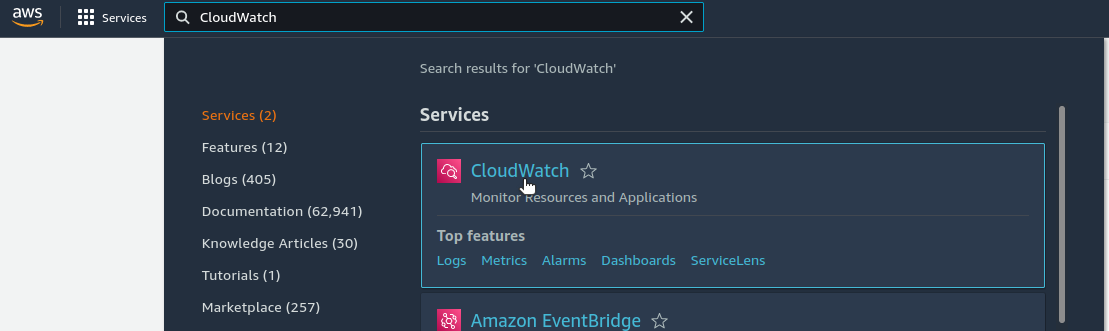
- Find and select the CloudWatch console:
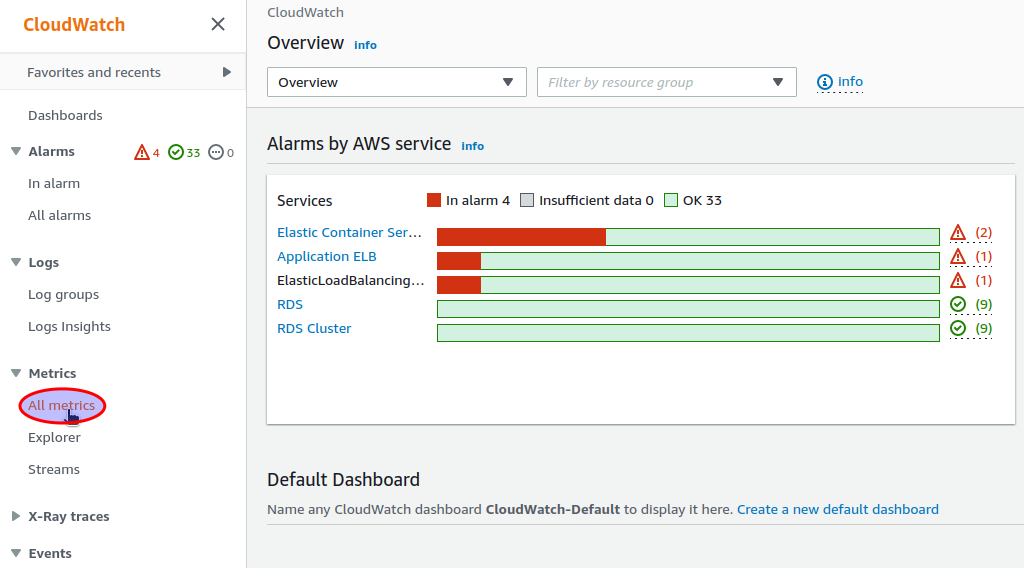
- Select the
All metricsview:
CloudFront distribution
To access CloudFront metrics in the CloudWatch console, first you have to obtain the CloudFront distribution id (check "
Find and select CloudFront distribution" in CloudFront Monitoring view). An example of
the distribution id is E1SKFNJURQU6G5.
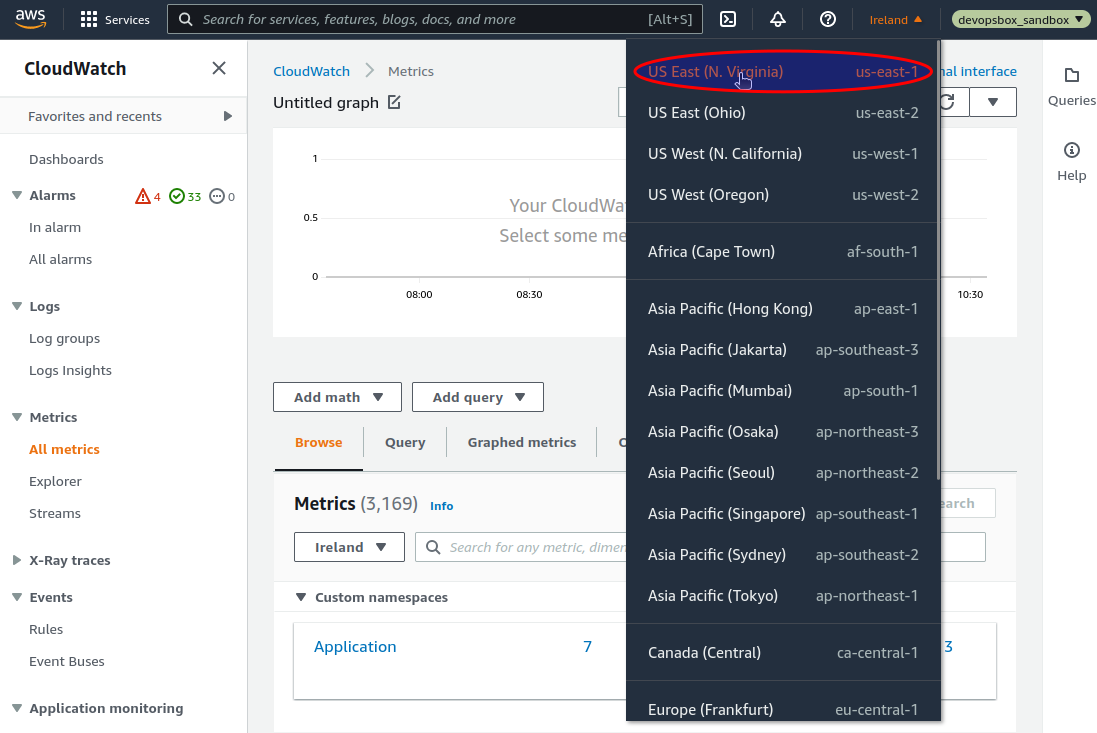
CloudFront metrics are available in the us-east-1 (N. Virginia) region. To view them, first you have to change your
current region in the AWS Console:
Then you can show all metrics related to your CloudFront distribution by
entering DistributionId="YOUR_DISTRIBUTION_ID" (
e.g. DistributionId="E1SKFNJURQU6G5"):
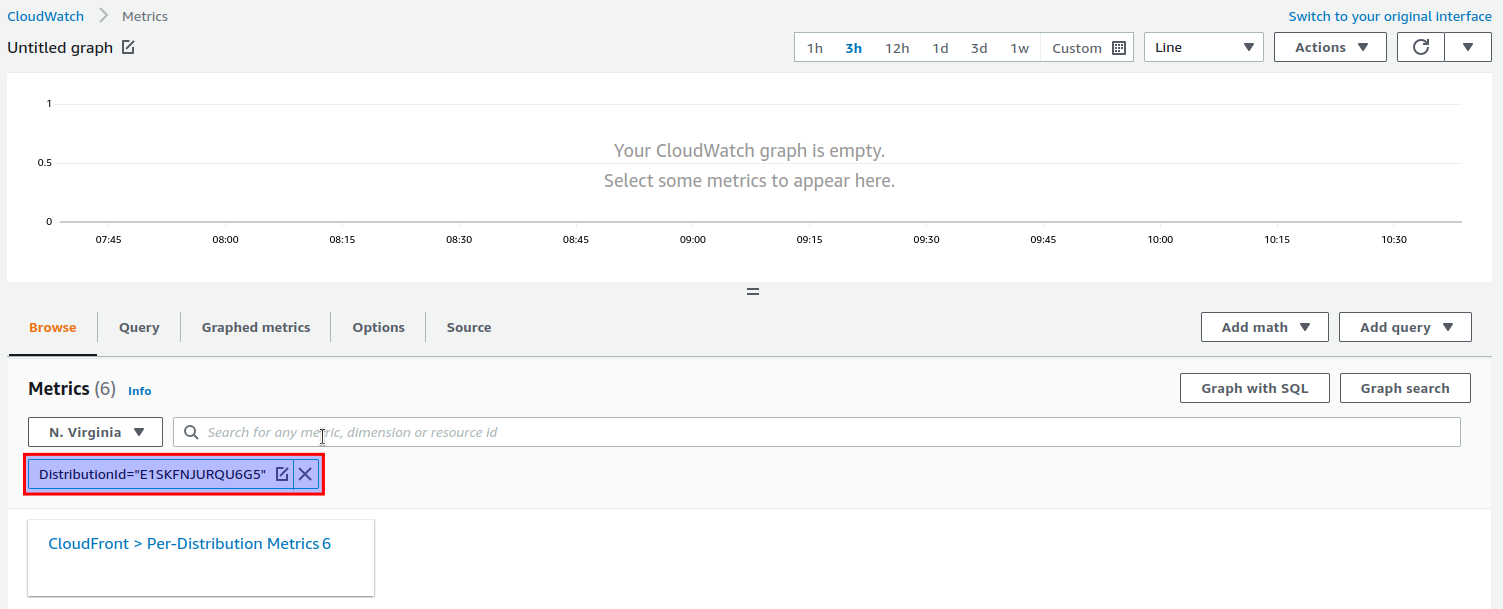
Here you can access all the standard CloudFront distribution metrics.
External health
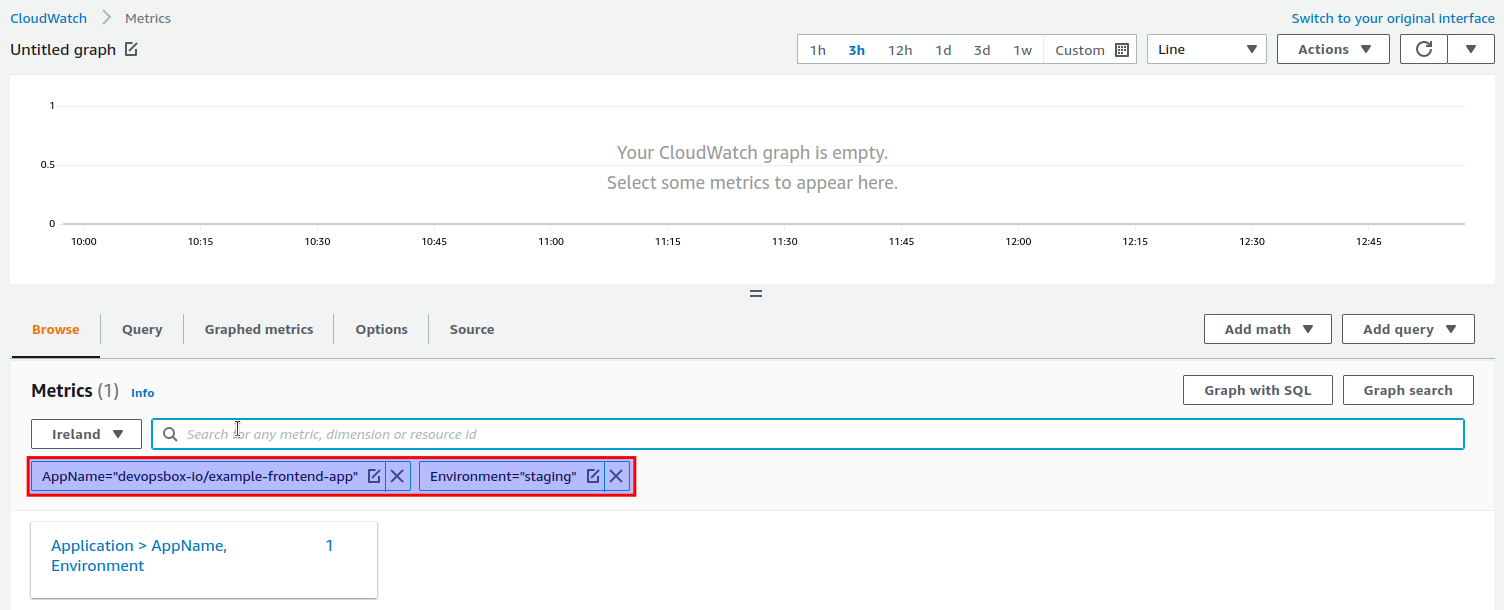
The ExternalHealthStatus custom metric indicates the "external" health status of your application. The value equals
the HTTP status obtained by calling your application's health check with AWS Lambda deployed outside your VPC. You can
find the metric by entering AppName="APP_NAME" and Environment="ENVIRONMENT" (
e.g. AppName="devopsbox-io/example-frontend-app" and Environment="staging"):
Note
The ExternalHealthStatus metric is available in your "normal" AWS Region. If you were viewing the standard
CloudFront metrics, remember to switch it back!
Notifications
There is only a single CloudWatch alarm created for each application's environment - the one for the ExternalHealth
metric, it is sending notifications to an SNS topic. There is a single SNS topic created for each cluster, for
example box-nonprod-monitoring-notification and box-prod-monitoring-notification. Although STATIC_WEBSITE
deployment type is not using ECS clusters, it follows the same rules when it comes to assigning notifications to SNS
topics.
You can subscribe to an SNS topic - there are multiple options, one of them is Slack via AWS Chatbot.
Alarms
Following alarms are created for each of your backend applications:
APP_NAME.ENVIRONMENT.ExternalHealth(e.g.devopsbox-io/example-frontend-app.staging.ExternalHealth) - sends a notification when the external health check fails (based on the External health metric).